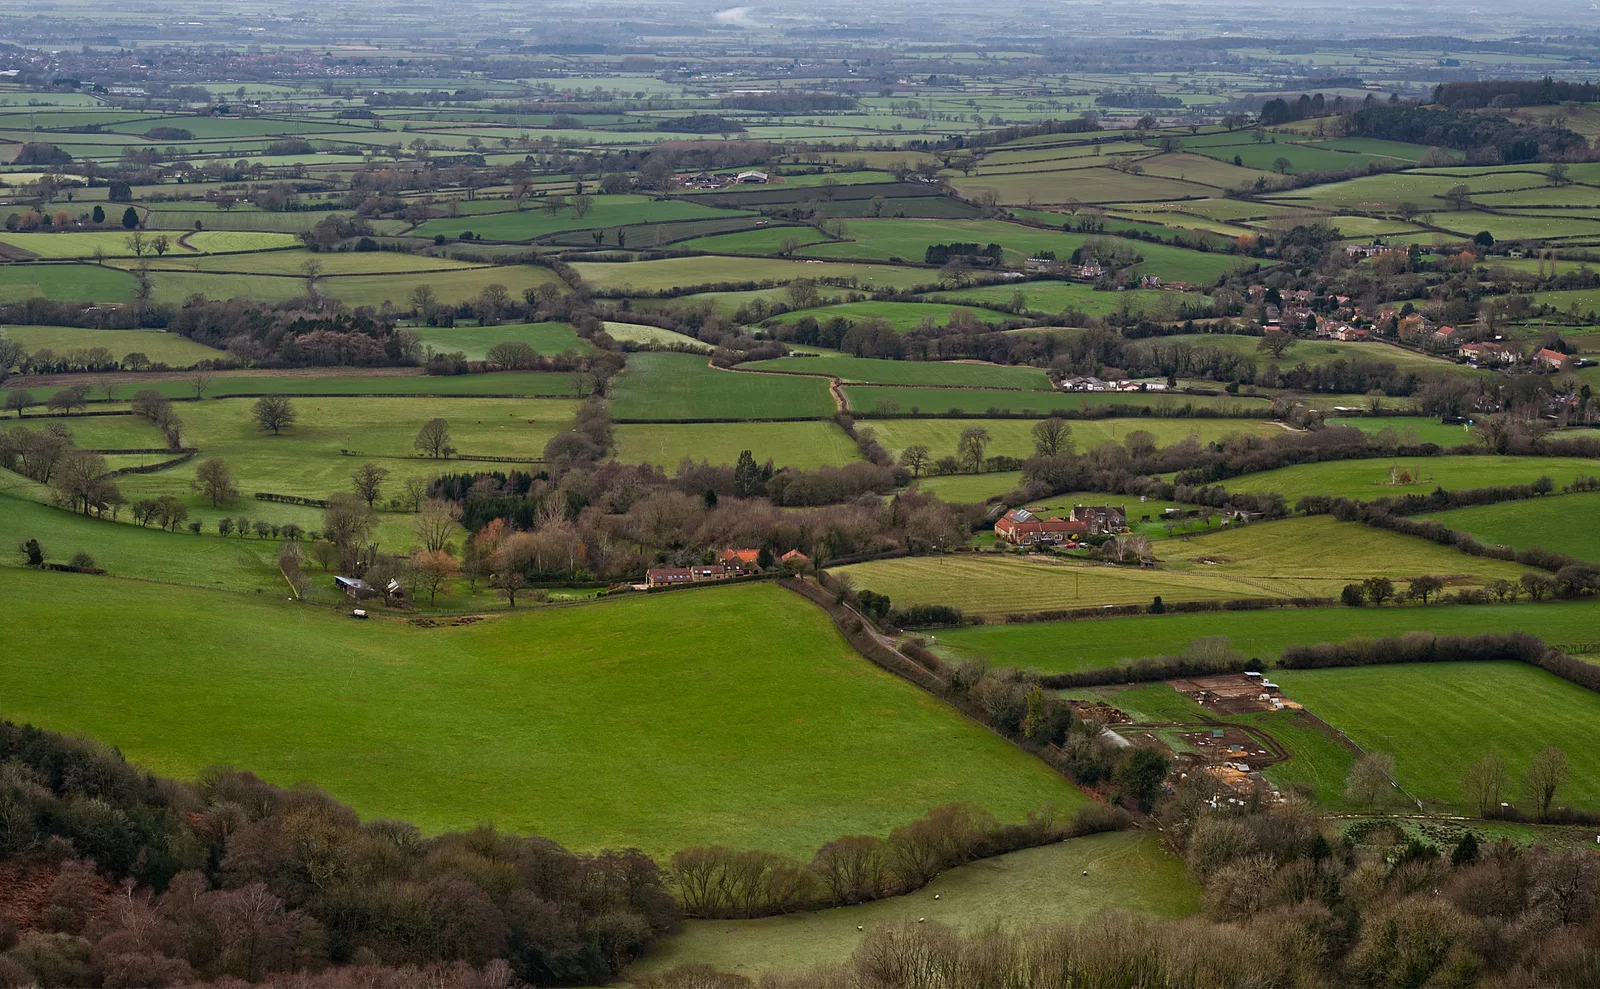
The short version: farming in England earned £5.4 billion in 2025, and the biggest gains were in the west. Total income from farming rose by 38% in the South West and 48% in the North West, stayed flat in Yorkshire and the Humber, and fell in the East of England (down 5.4%) and the North East (down 24%). Defra puts every region side by side in its Agricultural facts: England regional profiles, updated on 29 October with 2025 data. Below we've pulled out what's in them, region by region, in plain words.
Two different incomes, two different years
Before the numbers, one thing that trips people up. The fact sheets use two measures of income, and they don't cover the same period:
- Total Income from Farming (TIFF) is all the farming in a region added together: what farms produced, plus subsidies, minus what they spent. It is the profit, and the pay for the work of owners and other unpaid workers, for the whole region. It covers the calendar year 2025.
- Farm Business Income (FBI) is the average profit of a single farm business: its output minus its total costs. The latest figure is for 2024/25, the farm year from March 2024 to February 2025, so it mostly reflects the 2024 harvest.
Defra says the two shouldn't be compared directly. So when you read further down that average farm income rose by 49%, that's the 2024/25 year, not this one.
Where the money went in 2025
| Region | Total income from farming, 2025 | Change on 2024 | Per hectare, 2025 |
|---|---|---|---|
| North East | £115 million | −24% | £191 |
| North West | £583 million | +48% | £621 |
| Yorkshire and the Humber | £516 million | −0.2% | £463 |
| East Midlands | £884 million | +6.4% | £735 |
| West Midlands | £714 million | +12% | £766 |
| East of England | £853 million | −5.4% | £610 |
| South East (including London) | £601 million | +14% | £527 |
| South West | £1,133 million | +38% | £633 |
Source: Defra, Agricultural facts: England regional profiles (29 October 2026); per-hectare figures from Defra, Total Income from Farming in the regions of England in 2025 (24 September 2026), using all land on agricultural holdings.
The South West is the biggest earner, with 21% of England's farm income. Per hectare, though, the West Midlands comes out on top at £766, even though it is only fourth by total. The North East has been the smallest contributor for each of the past 16 years.
What moved the numbers
Defra's regional accounts for 2025 describe what moved:
- Crop output fell in 7 of the 8 regions. Defra puts this largely down to lower UK cereal prices, with plenty of grain on world markets, and to hot, dry weather at key planting and harvest times, which cut yields and left quality variable. In the East of England, the biggest crop region, crop output fell by £175 million (6.9%).
- Livestock went the other way. In the South West, livestock output rose by £380 million (12.0%) to £3.6 billion, mainly from milk (up £187 million, or 12.5%) and beef (up £150 million, or 23.4%). In the North West it rose by £175 million (8.8%) to £2.2 billion.
- Everything else rose everywhere. "Other outputs and subsidies", which covers things like holiday lets, contracting for neighbours and subsidy payments, went up in all eight regions.
The release doesn't give a separate reason for the North East's fall.
Average farm income, region by region (2024/25)
| Region | Average Farm Business Income, 2024/25 | Change on 2023/24 | Average farm size, 2025 |
|---|---|---|---|
| North East | £74,400 | +9.6% | 142 ha |
| North West | £94,400 | +83% | 75 ha |
| Yorkshire and the Humber | £73,800 | +41% | 93 ha |
| East Midlands | £63,700 | +97% | 105 ha |
| West Midlands | £66,500 | +15% | 69 ha |
| East of England | £78,300 | +17% | 132 ha |
| South East (including London) | £52,500 | +50% | 93 ha |
| South West | £68,200 | +89% | 71 ha |
| England | £71,200 | +49% | 90 ha |
Source: Defra, Agricultural facts: England regional profiles (29 October 2026). Farm Business Income covers farms with at least £21,000 of standard output; farm size covers commercial holdings in June 2025.
An average across all farm types hides a lot. Across England in 2024/25, specialist poultry farms averaged £235,900, dairy farms £153,800 and specialist pig farms £126,700, while cereal farms averaged £49,700 and grazing livestock farms £41,000. In some regions, grazing livestock farms averaged far less: £18,800 in Yorkshire and the Humber, £22,200 in the East Midlands and £29,000 in the West Midlands. At the other end, dairy farms in the North West averaged £204,700.
Every one of these figures comes with a margin of error, and some are wide. Defra's Farm Business Survey visited 1,426 farms to stand for about 49,300 farm businesses in England, so where a region has only a handful of farms of one type in the sample, one or two of them can swing the average. The clearest example in the tables: specialist pig farms in the East of England show an average of minus £11,700, give or take £76,100. Defra itself says such results should be treated with caution.
What each region farms
- North East (Northumberland, Tyne & Wear, Tees Valley, Durham). The largest farms in England, 142 hectares on average. Output of £879 million, led by beef (£170 million), mutton, lamb and goat (£128 million), wheat (£78 million) and milk (£53 million). Subsidies (less tax) made up 13.4% of total output value, the highest share of any region.
- North West (Cumbria, Lancashire, Cheshire, Greater Manchester, Merseyside). Milk brought in £1.1 billion of the region's £2.7 billion output, 41% of it. The region has 26% of England's dairy herd, and 60% of its farmed area is permanent pasture.
- Yorkshire and the Humber (North, East, West and South Yorkshire, Northern Lincolnshire). Pigmeat was the biggest earner at £560 million of a £3.5 billion output, ahead of poultry, beef and milk. Pig farms are only 4.4% of the region's holdings, yet the region keeps 41% of England's pigs.
- East Midlands (Lincolnshire, Leicestershire, Rutland, Northamptonshire, Derbyshire, Nottinghamshire). Output of £4.1 billion, led by poultry (£629 million), plants and flowers (£587 million) and fresh vegetables (£524 million). It grows 42% of England's hardy nursery stock and 28% of its field vegetables.
- West Midlands (Shropshire, Staffordshire, Herefordshire, Worcestershire, Warwickshire and the West Midlands conurbation). The smallest farms in England, 69 hectares on average. Output of £3.3 billion, led by milk (£628 million), poultry (£463 million), beef (£322 million) and fruit (£219 million). It has 30% of England's orchards.
- East of England (East Anglia, Essex, Bedfordshire, Hertfordshire). Output of £4.4 billion, led by poultry (£774 million), fresh vegetables (£557 million) and wheat (£547 million). 36% of its holdings are cereal farms, and it grows 28% of England's wheat and 32% of its potatoes. Its fertiliser bill, £337 million in 2025, was the highest of any region.
- South East (including London) (Berkshire, Buckinghamshire, Oxfordshire, Surrey, Sussex, Hampshire, Isle of Wight, Kent, London). Fruit leads at £425 million of a £2.4 billion output. The region grows 55% of England's small fruit and 45% of its orchard area, and it employs the most people per farm (4.0) and 34% of England's casual farm workers.
- South West (Gloucestershire, Wiltshire, the Bath/Bristol area, Devon, Dorset, Somerset, Cornwall, Isles of Scilly). Output of £5.2 billion, led by milk (£1.7 billion) and beef (£790 million). It keeps 33% of England's cattle and 39% of its dairy herd, has 22% of England's farm workforce, and spent £1.1 billion on animal feed, more than any other region.
Who is counted, and who isn't
The farm numbers come from Defra's June Survey, which counts commercial holdings: those with at least one of 5 hectares of agricultural land, 1 hectare of orchards, 0.5 hectares of vegetables, 0.1 hectares of protected crops, 10 cows, 50 pigs, 20 sheep, 20 goats or 1,000 poultry. Farm Business Income only covers farms with at least £21,000 of standard output. So smallholdings below those lines aren't in these averages, as Defra's guidance note explains.
On that basis, England had 8.9 million hectares of farmed land in June 2025, 32% of it rented, and 279,493 people working on farms, 2.8 per farm on average. Defra updates the fact sheets every autumn.
Sources
- Defra — Agricultural facts: Summary (29 October 2026)
- Defra — Agricultural facts: England regional profiles, all eight regional sheets
- Defra — Total Income from Farming in the regions of England in 2025 (24 September 2026)
- Defra — Agricultural facts: Guidance note
This is a summary of Defra's official statistics, not advice. A regional average describes no single farm.